March 2025: State of the Express Entry pool
Express Entry draws have seen an uptick in activity since the start of 2025, with Canada already holding the first draw of March through the system.
In the first two months of the year, Immigration, Refugees and Citizenship Canada (IRCC) issued more than 17,000 invitations to apply (ITAs).
Trends within the types of Express Entry draws have primarily held, with the immigration department continuing to prioritize Provincial Nominee Program (PNP) and Canadian Experience Class (CEC) candidates for invitations—with the exception of two French-language proficiency draws (February 19 and March 6).
This article will cover:
- The draws that occurred last month;
- The current distribution of scores within the pool; and
- How your CRS score ranks against other candidates in the pool.
Discover if You Are Eligible for Canadian Immigration
What draws took place in February?
February saw the issuance of 11,601 ITAs to candidates across four draws and three different draw types:
| Draw date | Draw type | ITAs issued | CRS cut-off score |
|---|---|---|---|
| February 4 | Provincial Nominee Program | 455 | 802 |
| February 5 | Canadian Experience Class | 4,000 | 521 |
| February 17 | Provincial Nominee Program | 646 | 750 |
| February 19 | French-language proficiency | 6,500 | 428 |
Overall, the number of ITAs issued in February is significantly greater than in each of the four previous months:
| Month | ITAs issued |
|---|---|
| October, 2024 | 5,961 |
| November, 2024 | 5,507 |
| December, 2024 | 2,561 |
| January, 2025 | 5,821 |
| February, 2025 | 11,601 |
On 27 February, IRCC confirmed via a press release that they will continue to prioritize Canadian Experience Class (CEC) candidates for ITAs through Express Entry throughout 2025.
In addition, the department has made significant changes to the Express Entry categories, removing the transport occupation category entirely, making major changes to the occupations within the STEM and trades categories, and adding a new category for occupations in education.
In 2025, the priority Express Entry categories are:
- Healthcare and social services occupations;
- Trade occupations;
- Education occupations; and
- French-language proficiency.
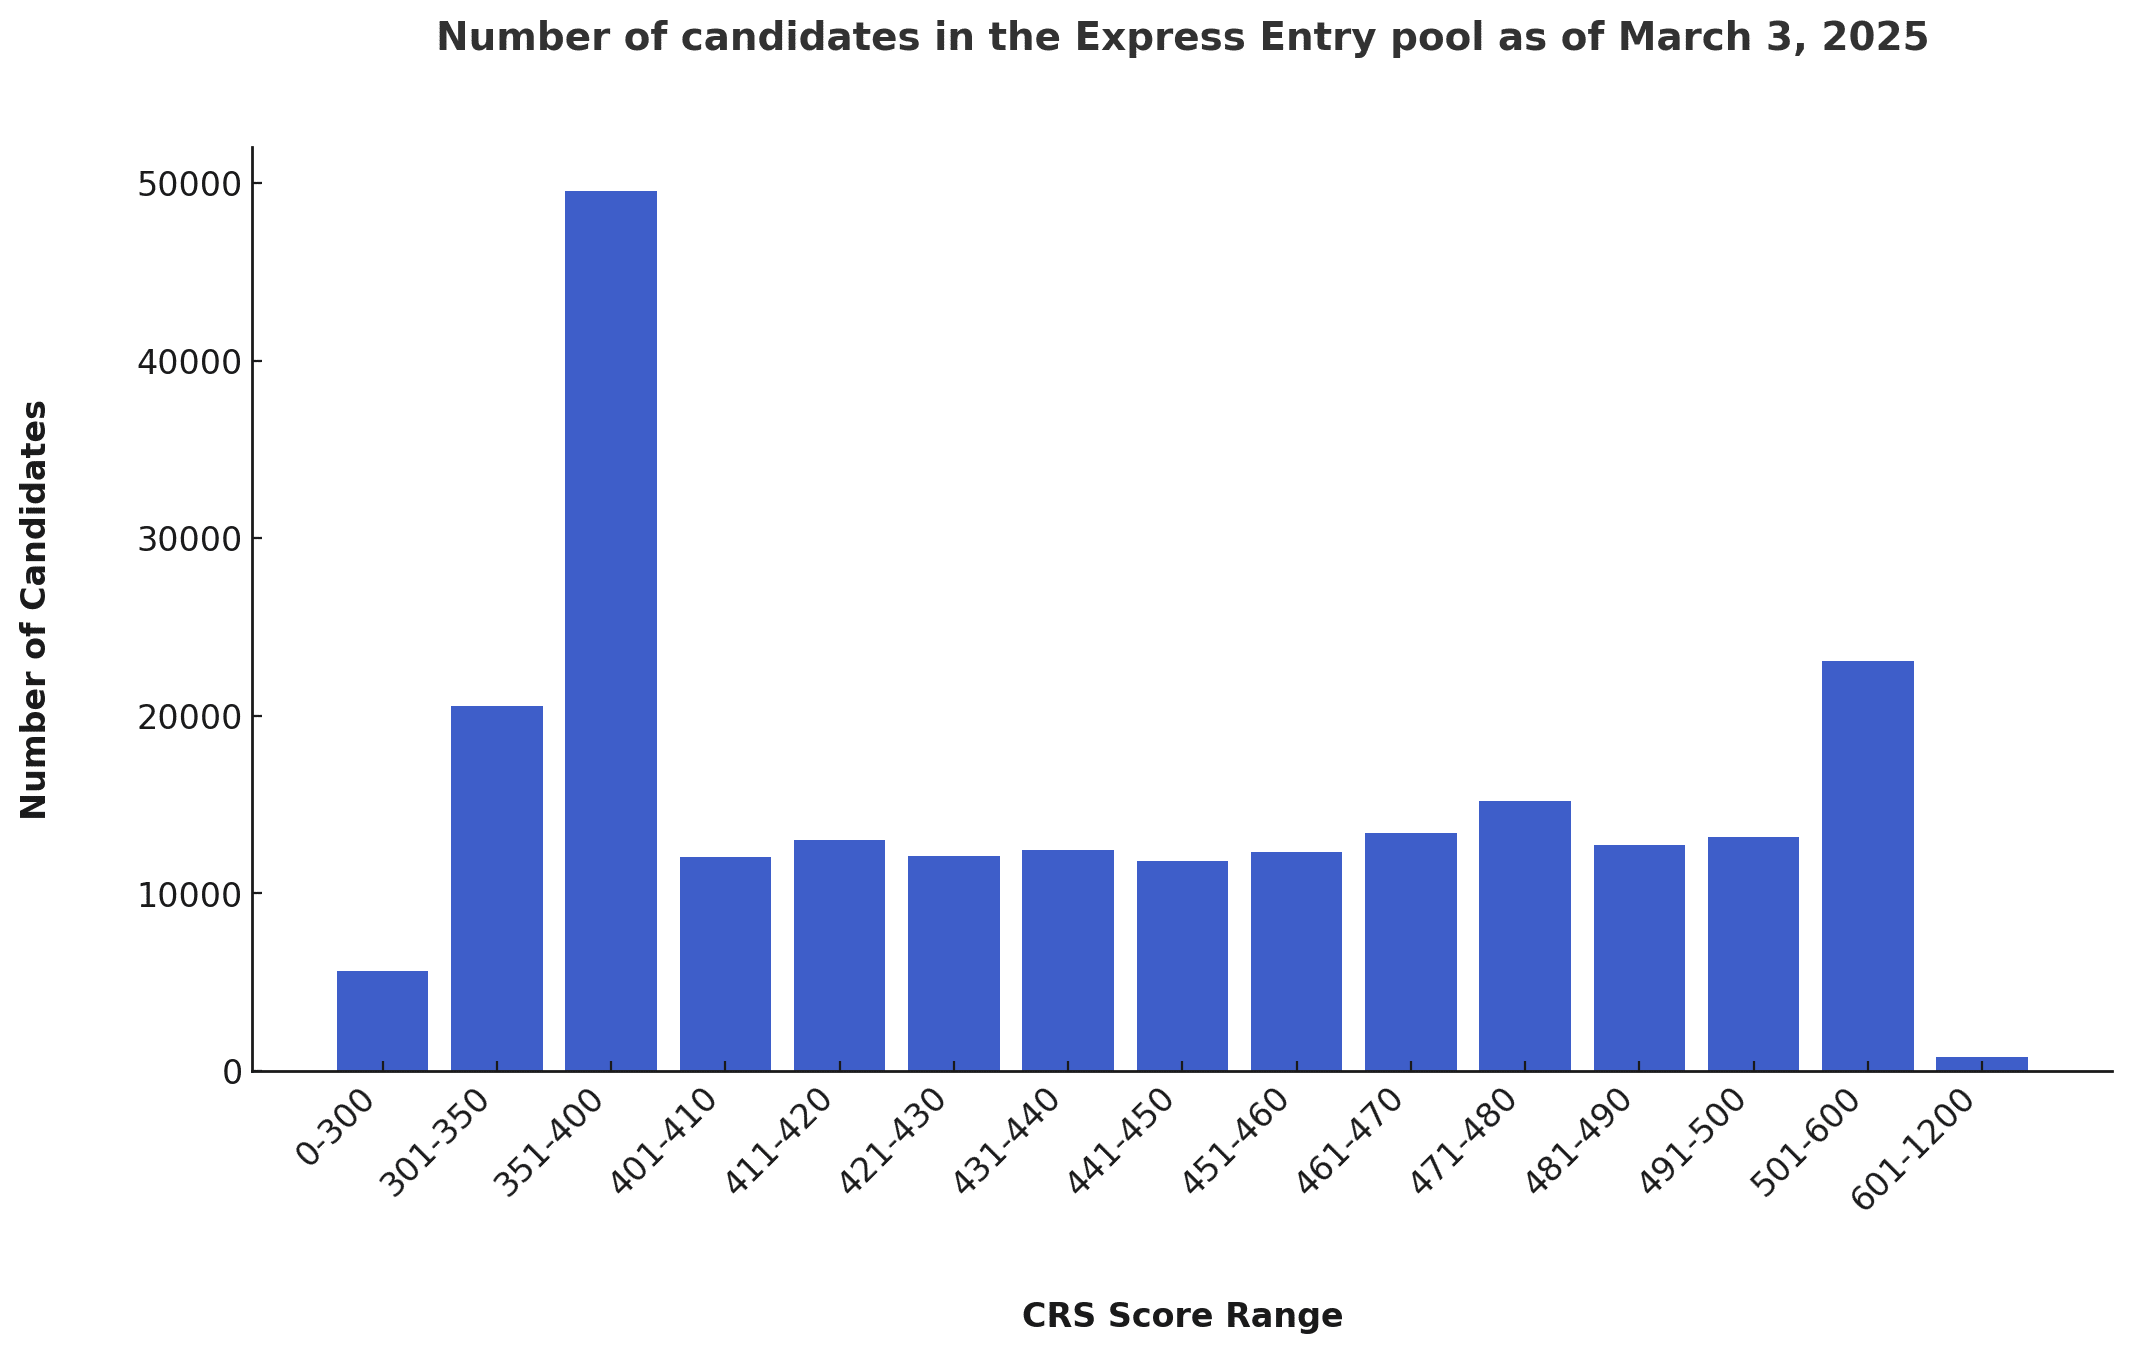
What is the current distribution of scores in the Express Entry pool?
The following table breaks down the number of candidates at each score range listed on the IRCC website, as of 3 March 2025:
| CRS Score Range | Number of Candidates |
|---|---|
| 0-300 | 5,637 |
| 301-350 | 20,573 |
| 351-400 | 49,555 |
| 401-410 | 12,046 |
| 411-420 | 13,014 |
| 421-430 | 12,072 |
| 431-440 | 12,429 |
| 441-450 | 11,822 |
| 451-460 | 12,298 |
| 461-470 | 13,377 |
| 471-480 | 15,213 |
| 481-490 | 12,730 |
| 491-500 | 13,174 |
| 501-600 | 23,075 |
| 601-1200 | 807 |
| Total | 227,822 |
Overall, there were 6,230 fewer candidate profiles at the start of March, as compared to the start of February. This is the first time in several months that the Express Entry pool has contracted in size.
How do scores in the Express Entry pool rank against each other?
The below table details the current distribution of scores within the Express Entry pool (as of March 3, 2025), as well as the percentile ranges of the individual scores at each score boundary. In addition, the proportion of candidates in each score boundary relative to the overall candidate pool has also been included.
Foreign nationals in the Express Entry system can use this table to gain a better understanding of how their score compares to other candidates currently in the pool.
Methodology: The percentile scores featured in the table were calculated for the upper boundary of each CRS score range. detailing the proportion of total candidates at or below the score. Percentiles are presented as ranges for easier comprehension, with all candidates in each score range falling somewhere in between the presented percentile ranges.
| CRS Score Range | Number of Candidates | Percentile | Pecentage |
|---|---|---|---|
| 0-300 | 5,637 | 2.47% | 2.47% |
| 301-350 | 20,573 | 11.50% | 9.03% |
| 351-400 | 49,555 | 33.26% | 21.75% |
| 401-410 | 12,046 | 38.54% | 5.29% |
| 411-420 | 13,014 | 44.26% | 5.71% |
| 421-430 | 12,072 | 49.55% | 5.30% |
| 431-440 | 12,429 | 55.01% | 5.46% |
| 441-450 | 11,822 | 60.20% | 5.19% |
| 451-460 | 12,298 | 65.60% | 5.40% |
| 461-470 | 13,377 | 71.47% | 5.87% |
| 471-480 | 15,213 | 78.15% | 6.68% |
| 481-490 | 12,730 | 83.73% | 5.59% |
| 491-500 | 13,174 | 89.52% | 5.78% |
| 501-600 | 23,075 | 99.65% | 10.13% |
| 601-1200 | 807 | 100.00% | 0.35% |
| Total | |||
- Do you need Canadian immigration assistance? Contact the Contact Cohen Immigration Law firm by completing our form
- Send us your feedback or your non-legal assistance questions by emailing us at media@canadavisa.com